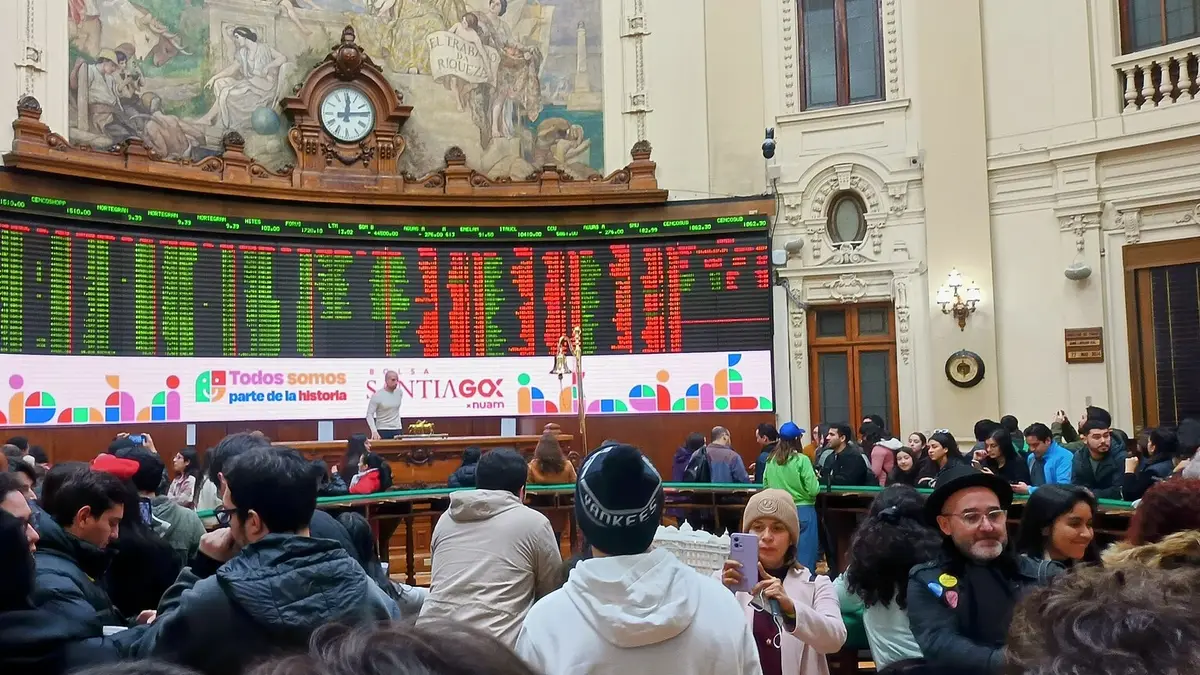
The S&P 500, the index of the 500 largest companies listed in the United States, closed on Tuesday, November 3, 2026 at 7,568.92 points, according to S&P Dow Jones Indices data published by the Federal Reserve Bank of St. Louis (FRED). So far this year it is up 10.6% in dollars and, because the dollar also rose in Chile, about 19% measured in pesos. The closing record is recent: 7,818.93 points on October 6.
It is probably the most followed stock index in the world and the benchmark for thousands of funds and ETFs. This guide explains what it is, which companies weigh most, how much it has returned year by year, what an ETF is, and what costs, taxes and currency risks someone investing in it from Chile faces. It is not a buy recommendation.
View the data as a table
| Index close | 7,568.92 |
| 2026 gain, in dollars | 10.6% |
| 2026 gain, measured in pesos | 19.1% |
| Record close | 7,818.93 |
What the S&P 500 is and which companies make it up
The index is calculated by S&P Dow Jones Indices and groups about 500 large US companies (slightly more than 500 shares, because some companies have two share classes). Each company is weighted by market value, so the largest drive much of the result. As of November 4, 2026, the ten largest holdings of the SPY ETF, which tracks the index, made up 37.5% of the portfolio, led by Apple (7.69%), NVIDIA (7.30%) and Microsoft (6.22%), according to State Street's fact page.
By sector, information technology weighs 36.7%, followed by financials (12.6%) and health care (10.4%). Energy, which dominates several Latin American indices, accounts for just 3.5%. That concentration explains why the S&P 500 looks little like Chile's IPSA, which is heavier in banks, utilities and natural resources; this article covers how to invest in the Santiago Stock Exchange.
How much the S&P 500 has returned: year by year
Using year-end closes published by FRED, the index went from 2,238.83 points at the end of 2016 to 7,568.92 on November 3, 2026: it rose 3.4-fold. Since November 7, 2016, the first data point in the ten-year series, the price gain equals 13.5% a year compounded, excluding dividends. There were two negative years in the decade: 2018 (-6.2%) and 2022 (-19.4%).
| Year | Close (points) | Annual change |
|---|---|---|
| 2017 | 2,673.61 | +19.4% |
| 2018 | 2,506.85 | -6.2% |
| 2019 | 3,230.78 | +28.9% |
| 2020 | 3,756.07 | +16.3% |
| 2021 | 4,766.18 | +26.9% |
| 2022 | 3,839.50 | -19.4% |
| 2023 | 4,769.83 | +24.2% |
| 2024 | 5,881.63 | +23.3% |
| 2025 | 6,845.50 | +16.4% |
| 2026 (to Nov 3) | 7,568.92 | +10.6% |
Source: close on the last trading day of each year, S&P Dow Jones Indices via FRED. Changes calculated by Pauta Financiera; they reflect the index price, excluding dividends. With dividends reinvested, total return is somewhat higher: the index dividend yield was 1.10% as of November 4, 2026, according to State Street.
View the data as a table
| S&P 500 | |
|---|---|
| 2016 | 2,239 |
| 2017 | 2,674 |
| 2018 | 2,507 |
| 2019 | 3,231 |
| 2020 | 3,756 |
| 2021 | 4,766 |
| 2022 | 3,840 |
| 2023 | 4,770 |
| 2024 | 5,882 |
| 2025 | 6,846 |
| 2026 | 7,569 |
That 13.5% a year is the effect of compound interest over a very favorable decade, not a promise. In other periods the index went years without recovering its highs. To see how an annual rate turns into a final amount, see our guide to compound interest with examples in pesos.
How Wall Street has done in 2026
The year was not a straight line. The index rose in January to 6,978.60 points on the 27th, but fell 9.1% to 6,343.72 on March 30, amid the war in the Middle East and the oil price spike. From there it recovered strongly: +10.4% in April and a new record on October 6, at 7,818.93. In early November it trades 3.2% below that peak.
View the data as a table
| S&P 500 | |
|---|---|
| Nov-25 | 6,849 |
| Dec-25 | 6,846 |
| Jan-26 | 6,939 |
| Feb-26 | 6,879 |
| Mar-26 | 6,529 |
| Apr-26 | 7,209 |
| May-26 | 7,580 |
| Jun-26 | 7,499 |
| Jul-26 | 7,490 |
| Aug-26 | 7,686 |
| Sep-26 | 7,652 |
| Oct-26 | 7,580 |
| Nov 3 | 7,569 |
For a Chilean investor, the dollar added another layer. The observed dollar went from CLP 911.18 on December 30, 2025 to CLP 981.82 on November 3, 2026 (+7.8%), according to mindicador.cl. That is why, measured in pesos, the S&P 500 is up about 19% in 2026 (Pauta Financiera calculation). The effect can also work against you: if the dollar falls, the gain in pesos shrinks. What drives the exchange rate is covered in our article on the dollar in Chile.
- 1993SPY, the index's first big ETF, is launchedJanuary 22
- 2000BlackRock launches IVVMay 15
- February–March 2020The pandemic knocks it down 33.9% in a month3.386 → 2.237
- 2022Rate hikes: down 19.4% for the year
- March 2026A 9.1% correction from January6.979 → 6.344
- October 6, 2026All-time closing record: 7,818.93
What an ETF is and how it tracks the index
An index cannot be bought directly: it is a calculation. What you buy is an ETF (exchange-traded fund), a fund that holds the index's shares in the same proportions and whose units trade on an exchange like a share. A single unit gives exposure to all 500 companies. Its main cost is the expense ratio, which the fund deducts from its assets.
| SPDR S&P 500 ETF Trust (SPY) | 0.0945% | 818,539 | 504 | 1993 |
| iShares Core S&P 500 ETF (IVV) | 0.0300% | 886,841 | 505 | 2000 |
The two largest ETFs tracking the S&P 500 are SPY, from State Street, with an expense ratio of 0.0945% and US$818,539 million in assets, and IVV, from iShares (BlackRock), with 0.03% and US$886,841 million, according to each issuer's fact page as of November 4, 2026. The expense gap looks tiny, but on a US$10,000 investment it means US$9.45 versus US$3 a year, before other costs.
Do you offer access to international shares or ETFs? Reach Pauta Financiera readers looking to invest outside Chile.
See advertising optionsHow to invest in the S&P 500 from Chile
There are three common routes. None is better in the abstract: it depends on the amount, the currency you want to invest in and how much you value simplicity versus cost.
| Route | How it works | Costs to check |
|---|---|---|
| Chilean broker with access to international markets | Buys the ETF on the New York exchange on the client's behalf | International commission (for example, 0.25% with a US$15 minimum in Renta 4's 2026 schedule), custody, peso-to-dollar conversion |
| Chilean mutual or investment funds that invest in the index | You invest in pesos or dollars with a local manager | Manager's annual fee, redemption charge |
| Foreign platform or broker | Direct account abroad | Commissions, international transfers, exchange rate, custody outside Chile |
Source of the example commission: Renta 4 Corredores de Bolsa 2026 fee schedule, North American markets via platform, plus VAT, checked November 5, 2026. Each broker has its own schedule. To compare local fund costs, see our mutual funds guide.
A practical detail: with a US$15 minimum per trade, a US$1,000 purchase pays 1.5% in commission, while a US$10,000 one pays 0.25%. As on the Chilean exchange, minimum charges penalize small purchases.

Taxes and exchange rate for the Chilean investor
Dividends. The United States withholds tax on dividends its companies and funds pay to foreign investors. Since 2024 the Chile–US double taxation treaty has been in force, setting a general withholding of 15% on dividends for Chilean residents (5% for holdings of at least 10% of the company), versus the 30% applied without a treaty, according to analysis by law firm Carey. To claim it, brokers usually ask for form W-8BEN.
Capital gains. The Article 107 benefit of Chile's Income Tax Law, which until the end of 2026 taxes gains on liquid shares at 10% and from 2027 exempts them, covers shares of listed corporations incorporated in Chile and certain funds, according to SII Circular 39 of 2022. A foreign ETF bought in New York is not in that category, so its gain follows the general regime. It is advisable to review each case with a tax adviser.
| Item | What happens | Source |
|---|---|---|
| US withholding on dividends | 15% under the treaty (30% without it) | Chile–US treaty, in force since 2024 |
| Gain on selling a foreign ETF | General regime (Art. 107 does not apply) | SII, Circular 39 of 2022 |
| ETF expense ratio | 0.03% to 0.0945% for IVV and SPY | Issuers, Nov 4, 2026 |
| Exchange rate | Adds to or subtracts from returns in pesos: +7.8% in 2026 | Central Bank via mindicador.cl |
Risks of investing in the index
- Steep falls: the index lost 33.9% between February 19 and March 23, 2020 and 25.4% between January and October 2022, using FRED closes.
- Concentration: ten companies make up more than a third of the portfolio and technology, 36.7%.
- Currency: returns in pesos depend on the dollar, which can rise or fall.
- Time frame: like any equity investment, it suits money that will not be needed for several years.
Frequently asked questions
How much has the S&P 500 returned in 2026?
As of November 3, 2026 it is up 10.6% in dollars, excluding dividends, according to closes published by FRED. Measured in Chilean pesos, the gain is around 19% because the dollar rose 7.8% over the same period.
What is an S&P 500 ETF?
It is a fund that tracks the index by buying its shares in the same proportions and whose units trade on an exchange. The largest are SPY and IVV, with expense ratios of 0.0945% and 0.03%.
Can you invest in the S&P 500 from Chile with a few dollars?
Yes, but minimum charges weigh: with a US$15 minimum commission, a US$1,000 purchase pays 1.5%. Some local funds accept smaller amounts; check their annual fee.
How much tax is paid on US dividends?
Under the Chile–US treaty, in force since 2024, the general US withholding is 15%. Those dividends are then declared in Chile, under the rules to avoid double taxation.
What is the S&P 500's all-time high?
The closing record is 7,818.93 points, reached on October 6, 2026, according to the S&P Dow Jones Indices series published by FRED.
Notice: this information is journalistic and educational, not financial advice. Check the terms and the total cost (CAE) with the institution before signing up.