The copper price stood at US$6.42 a pound on November 5, 2026, according to the London Metal Exchange (LME) series published by mindicador.cl. That is a 2.4% drop from US$6.58 the day before, but the metal is up 16.1% for the year: on December 30, 2025 it closed at US$5.53.
Measured in Chilean pesos, the rise is bigger because the dollar also went up. With the observed dollar rate of CLP 970.95 on November 5 (mindicador.cl), a pound of copper is worth about CLP 6,233, versus CLP 5,039 at the end of 2025 (US$5.53 at CLP 911.18), an increase of 23.7%. A metric ton is worth about US$14,154 at today's price.
View the data as a table
| Price per pound | US$6.42 |
| The pound in pesos | $6,233 |
| 2026 gain, in dollars | 16.1% |
| Year's high | US$6.72 |
Copper price today and in recent days
November began with copper easing from late-October levels. On October 30 the pound closed at US$6.66, its highest since October 15; in the first four trading days of November it moved between US$6.42 and US$6.61. October's average was US$6.58, the highest of any month in 2026 in the mindicador.cl series.
| Date | US$ per pound | Daily change |
|---|---|---|
| October 28 | 6.58 | +0.3% |
| October 29 | 6.65 | +1.1% |
| October 30 | 6.66 | +0.2% |
| November 2 | 6.61 | −0.8% |
| November 3 | 6.50 | −1.7% |
| November 4 | 6.58 | +1.2% |
| November 5 | 6.42 | −2.4% |
Source: Copper pound on the London Metal Exchange, series published by mindicador.cl, checked on November 5, 2026. Changes calculated by Pauta Financiera.
How the copper price has risen in 2026
The year had two phases. From January to April the pound was nearly flat, between US$5.73 and US$5.88 on a monthly average basis, and hit its low for the year, US$5.37, on March 24. From May a climb began that took the September average to US$6.56 and October's to US$6.58, with the high of US$6.72 on September 11 and 24.
View the data as a table
| Copper | |
|---|---|
| Jan | US$5.89 |
| Feb | US$6.01 |
| Mar | US$5.50 |
| Apr | US$5.87 |
| May | US$6.11 |
| Jun | US$6.00 |
| Jul | US$6.17 |
| Aug | US$6.56 |
| Sep | US$6.55 |
| Oct | US$6.66 |
| Nov* | US$6.42 |
The following table shows each month's average in dollars and its equivalent in pesos using the same month's average observed dollar rate. The peso value rose 24.7% between January and October, more than the dollar price (12.3%), because over that period the dollar went from an average of CLP 884 to CLP 982. To see what moved the peso, read our story on the dollar in Chile in 2026.
| January | 5.86 | 883.97 | 5,181 |
| February | 5.88 | 862.02 | 5,065 |
| March | 5.73 | 909.89 | 5,210 |
| April | 5.83 | 897.89 | 5,233 |
| May | 6.11 | 897.64 | 5,485 |
| June | 6.17 | 903.38 | 5,570 |
| July | 6.12 | 930.97 | 5,699 |
| August | 6.47 | 917.66 | 5,942 |
| September | 6.56 | 947.27 | 6,217 |
| October | 6.58 | 982.28 | 6,461 |
| November (1-5) | 6.53 | 981.51 | 6,407 |
View the data as a table
| Copper, US$ per pound | Observed dollar, pesos | |
|---|---|---|
| Jan | 6 | 884 |
| Feb | 6 | 862 |
| Mar | 6 | 910 |
| Apr | 6 | 898 |
| May | 6 | 898 |
| Jun | 6 | 903 |
| Jul | 6 | 931 |
| Aug | 6 | 918 |
| Sep | 7 | 947 |
| Oct | 7 | 982 |
That breaks a rule often repeated in Chile: when copper rises, the dollar falls. In 2026 the opposite happened for much of the year, because other factors weighed in, such as the oil rally and tension in the Middle East in October. We explain it in our story on the oil slump after the US midterm elections.
Copper's value in perspective: averages since 2015
According to the World Bank Pink Sheet, copper averaged US$13,539 per metric ton between January and October 2026, equal to US$6.14 a pound. That is 36% above the 2025 average (US$9,947 per ton, US$4.51 a pound) and almost triple 2016, when it hit the decade's lowest average: US$4,868 per ton (US$2.21 a pound). October 2026, at US$14,508, is the highest monthly average in the institution's series.
| Year | US$ per metric ton | US$ per pound |
|---|---|---|
| 2015 | 5,510 | 2.50 |
| 2016 | 4,868 | 2.21 |
| 2017 | 6,170 | 2.80 |
| 2018 | 6,530 | 2.96 |
| 2019 | 6,010 | 2.73 |
| 2020 | 6,174 | 2.80 |
| 2021 | 9,317 | 4.23 |
| 2022 | 8,822 | 4.00 |
| 2023 | 8,490 | 3.85 |
| 2024 | 9,142 | 4.15 |
| 2025 | 9,947 | 4.51 |
| 2026 (Jan-Oct) | 13,539 | 6.14 |
Source: World Bank, Pink Sheet (grade A copper, LME), updated November 3, 2026; conversion to pounds by Pauta Financiera. One metric ton equals 2,204.62 pounds.
The 2021 jump set a new floor: since then the annual average has not dropped below US$3.85 a pound. Another metal having a record year is gold; we cover it in the gold price in Chile today.
- Dec 2008US$1.39/lbDecember average amid the global financial crisis (US$3,072 per ton).
- Feb 2011US$4.48/lbHigh of the 2010s (US$9,868 per ton).
- Jan 2016US$2.03/lbBottom at the end of the supercycle (US$4,472 per ton).
- Apr 2020US$2.29/lbSlump from the covid-19 pandemic (US$5,058 per ton).
- May 2021US$4.61/lbFirst monthly average above US$10,000 per ton.
- Mar 24, 2026US$5.37/lb2026 daily low.
- Sep 11, 2026US$6.72/lb2026 daily high, matched on September 24.
- Oct 2026US$6.58/lbHighest monthly average in the World Bank series (US$14,508 per ton).
Does your company work in mining, commodities or investments? Advertise on Pauta Financiera and reach readers who follow the copper price every day.
See advertising optionsChile, the world's largest copper producer
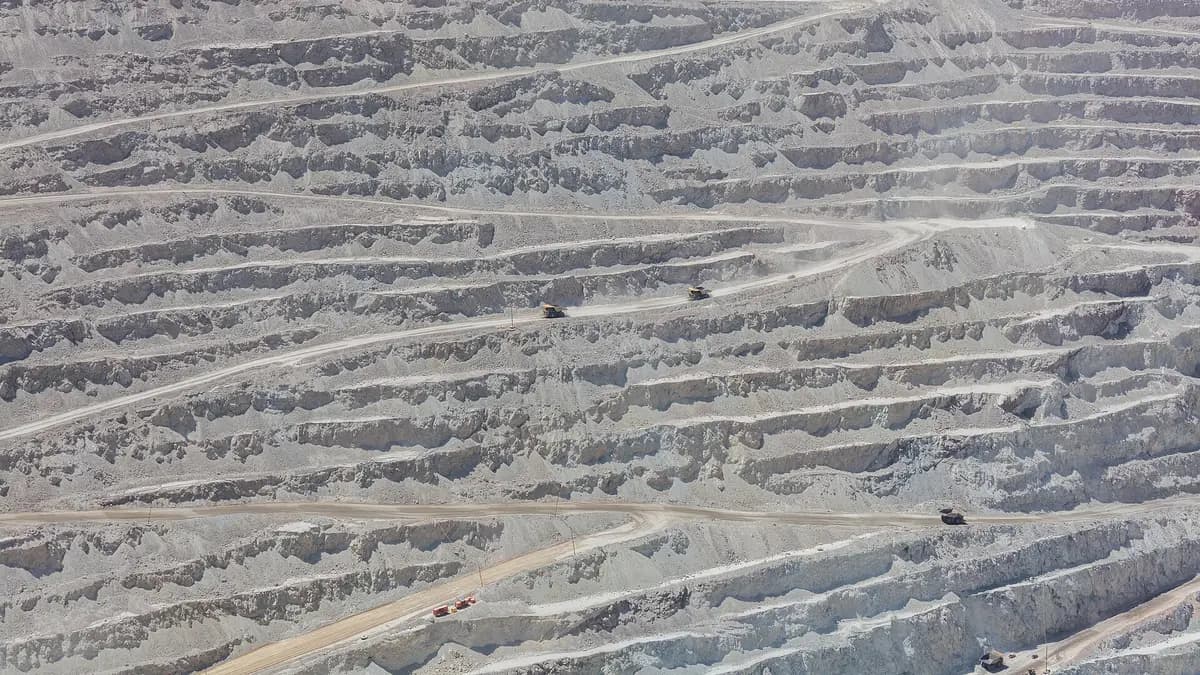
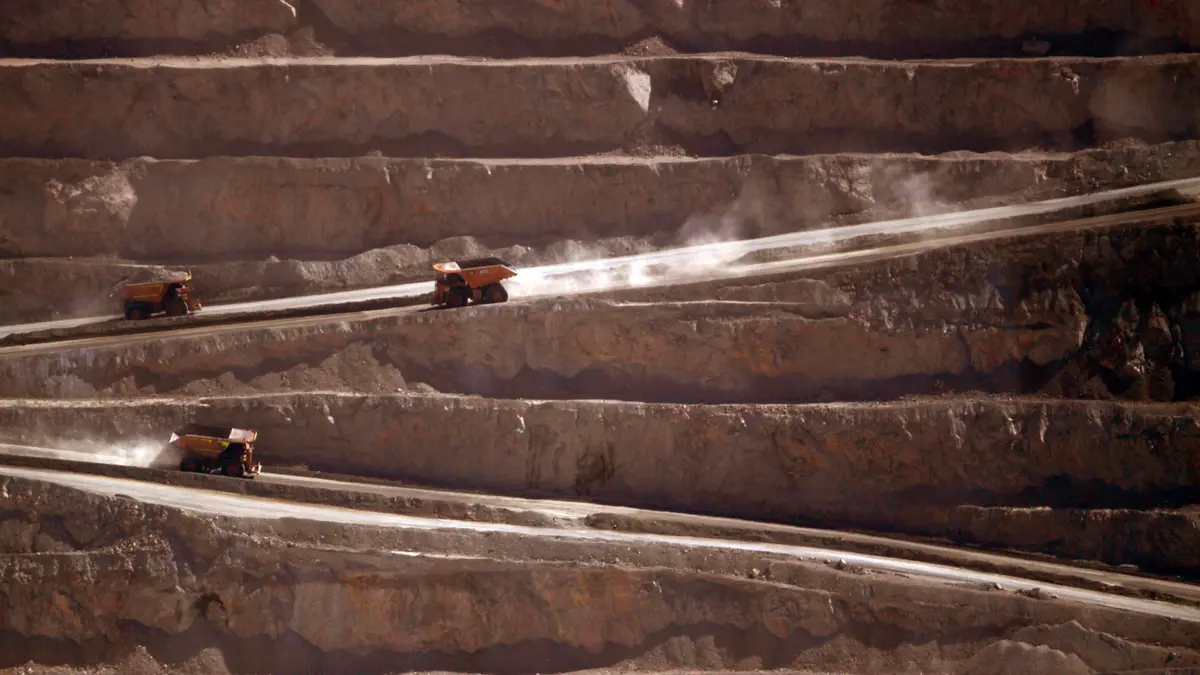
That is why the copper price matters so much in Chile. According to the US Geological Survey (USGS), the country produced about 5.3 million metric tons of mined copper in 2025, roughly 23% of the world total of 23 million. Next come the Democratic Republic of the Congo (3.2 million) and Peru (2.7 million). In 2024 Chilean output was 5.51 million.
View the data as a table
| Chile | 5,300 |
| DR Congo | 3,200 |
| Peru | 2,700 |
| People's Republic of China | 1,800 |
| Russia | 1,300 |
| United States | 1,000 |
| Zambia | 940 |
| Australia | 730 |
| Indonesia | 710 |
| Kazakhstan | 710 |
| Mexico | 690 |
| Canada | 500 |
| Poland | 410 |
| Country | Mine production 2024 (thousand t) | Mine production 2025e (thousand t) | Reserves (million t) |
|---|---|---|---|
| Chile | 5,510 | 5,300 | 180 |
| DR Congo | 2,990 | 3,200 | 80 |
| Peru | 2,740 | 2,700 | 85 |
| China | 1,840 | 1,800 | 41 |
| Russia | 1,020 | 1,300 | 80 |
| United States | 1,050 | 1,000 | 47 |
| Australia | 765 | 730 | 100 |
| World total | 23,000 | 23,000 | 980 |
Source: USGS, Mineral Commodity Summaries 2026: Copper; 2025 is an estimate.
With 180 million tons, Chile holds about 18% of the world reserves estimated by the USGS (980 million). The metal also matters on the local stock exchange: several IPSA companies are linked to mining, so its price moves part of the index.

How the copper price is measured
The benchmark price is for grade A cash copper on the London Metal Exchange (LME), quoted in dollars per metric ton. In Chile it is almost always reported in dollars per pound, the unit used by the Central Bank and local media. There is also the New York COMEX price, which in 2025 averaged more than London's because of uncertainty over US tariffs, according to the USGS. These are the equivalents at the November 5 price:
| Unit | In dollars | In Chilean pesos |
|---|---|---|
| 1 pound (453.6 grams) | US$6.42 | $6,233 |
| 1 kilogram | US$14.15 | $13,743 |
| 1 metric ton | US$14,154 | $13,742,513 |
Pauta Financiera calculation with the pound at US$6.42 (Copper pound on the London Metal Exchange, series published by mindicador.cl) and the dollar at CLP 970.95 (observed dollar rate via mindicador.cl), both from November 5, 2026. These are reference values for refined metal; scrap copper fetches considerably less and depends on the buyer.
What moves the price
- Demand from China, the world's largest refiner: it produced about 14 million tons of refined copper in 2025, close to half the total, according to the USGS.
- Mine supply, which depends on ore grades, labor disputes and accidents at the big producers.
- The global dollar: since it is priced in dollars, a weaker dollar usually makes it cheaper for other buyers.
- The energy transition: electric cars, power grids and data centers use a lot of copper.
- Tariffs and trade policy, such as those of the United States, which split New York and London prices in 2025.
Frequently asked questions about the copper price
What is the copper price today?
On November 5, 2026 a pound of copper stood at US$6.42, about CLP 6,233 at the day's observed dollar rate.
How much has copper risen in 2026?
16.1% in dollars since the 2025 close (US$5.53) and 23.7% measured in pesos.
What was the highest copper price in 2026?
US$6.72 a pound, on September 11 and 24. The low was US$5.37, on March 24.
How much is a ton of copper worth?
At the November 5 price, about US$14,154. The October 2026 average was US$14,508, according to the World Bank.
Which country produces the most copper?
Chile, with about 5.3 million tons in 2025, roughly 23% of the world total, according to the USGS.
This information is journalistic and educational, not investment advice. The copper price changes every trading day.