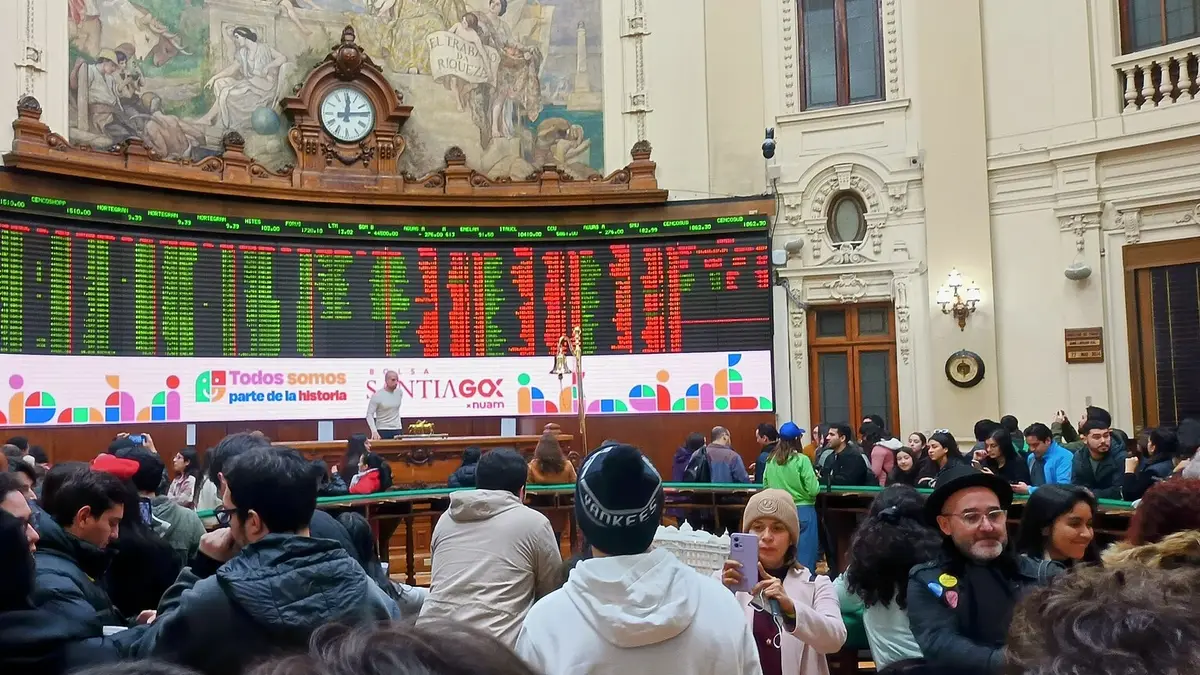
The IPSA closed October 2026 at 10,254.15 points, down 6.52% for the month, the worst since October 2023, according to the Santiago Stock Exchange's Monthly Statistical Summary. With that result, the Chilean market's main index is down 2.17% in 2026 and stands 10.2% below its January close (11,420.07 points), after a 2025 in which it gained 56.2%, its best year since 1993.
2026 also changed the index from the inside: since September 1 it has been run by MSCI instead of S&P Dow Jones Indices, it is called the MSCI IPSA and it went from 30 to 31 companies. This guide explains what the IPSA is, who is in it and how it has performed month by month.
View the data as a table
| October close | 10,254.15 points |
| Change in 2026 | -2.17% |
| Gain in 2025 | +56.21% |
| Companies in the index | 31 |
What the IPSA is
The IPSA (Índice de Precios Selectivo de Acciones) is the benchmark index of the Santiago Stock Exchange. It brings together the largest and most traded stocks in the Chilean market, and its value, in points, rises or falls with the prices of those stocks, weighted by size. When the news says 'the market rose', it is almost always talking about the IPSA.
The Santiago Stock Exchange created it in 1977. From August 6, 2018 it was run by S&P Dow Jones Indices under the name S&P CLX IPSA, which also fixed it at 30 stocks (it previously could hold up to 40), according to CNN Chile. In 2026, nuam, the holding that integrates the stock exchanges of Chile, Colombia and Peru, switched providers and chose MSCI, which already calculates the indices of the other two markets.
What changed in the IPSA with MSCI
The Santiago Stock Exchange published the initial composition of the new index on August 20, 2026, and it took effect on September 1. The main changes, according to Diario Estrategia and Chócale:
- Variable number of companies: the IPSA had a fixed 30 stocks since 2018; the MSCI IPSA starts with 31 and the number can change at each review based on size and liquidity.
- More weight on free float: selection and weighting use market capitalization adjusted for the shares that actually trade, excluding those held by controlling shareholders.
- Four reviews a year: the IPSA used to be reviewed twice a year and the IGPA once; now both are reviewed quarterly.
- Continuity: the historical series remains comparable and daily exchange operations do not change.
On its first day under MSCI, the index closed at 11,386 points, up 0.63%, according to CNN Chile.

Which companies make up the IPSA
These are the 31 companies in the IPSA since September 1, 2026. The table lets you search by name, ticker or sector. Each company's weight is calculated by MSCI from its free-float-adjusted market capitalization and is not published openly, which is why the table shows the sector.
| Aguas Andinas | AGUAS-A | Utilities |
| Banco de Chile | CHILE | Financials |
| Banco de Crédito e Inversiones (Bci) | BCI | Financials |
| Banco Itaú Chile | ITAUCL | Financials |
| Banco Santander-Chile | BSANTANDER | Financials |
| CAP | CAP | Materials |
| Cencosud | CENCOSUD | Consumer discretionary |
| Cencosud Shopping | CENCOMALLS | Real estate |
| Colbún | COLBUN | Utilities |
| Compañía Cervecerías Unidas (CCU) | CCU | Consumer staples |
| Compañía Sud Americana de Vapores | VAPORES | Industrials |
| Embotelladora Andina (serie B) | ANDINA-B | Consumer staples |
| Entel | ENTEL | Communications |
| Empresas CMPC | CMPC | Materials |
| Empresas Copec | COPEC | Energy |
| Enel Américas | ENELAM | Utilities |
| Enel Chile | ENELCHILE | Utilities |
| Engie Energía Chile | ECL | Utilities |
| Falabella | FALABELLA | Consumer discretionary |
| Inversiones Aguas Metropolitanas | IAM | Utilities |
| Inversiones La Construcción (ILC) | ILC | Financials |
| LATAM Airlines Group | LTM | Industrials |
| Parque Arauco | PARAUCO | Real estate |
| Plaza (Mallplaza) | MALLPLAZA | Real estate |
| Quiñenco | QUINENCO | Industrials |
| Ripley Corp | RIPLEY | Consumer discretionary |
| Salfacorp | SALFACORP | Industrials |
| SMU | SMU | Consumer staples |
| SQM (serie B) | SQM-B | Materials |
| Viña Concha y Toro | CONCHATORO | Consumer staples |
| Pampa Investments | PAMPA | Financials |
By sector, the IPSA mirrors the Chilean economy: 6 banks and financial firms (Banco de Chile, Bci, Itaú, Santander, ILC and Pampa Investments) and 6 power and water utilities (Aguas Andinas, Colbún, Enel Américas, Enel Chile, Engie and IAM) account for 12 of the 31. Consumer staples and industrials follow with 4 each, and retail, shopping malls and materials with 3 each.
| Sector | Companies | How many |
|---|---|---|
| Utilities | AGUAS-A, COLBUN, ENELAM, ENELCHILE, ECL, IAM | 6 |
| Financials | CHILE, BCI, ITAUCL, BSANTANDER, ILC, PAMPA | 6 |
| Consumer staples | CCU, ANDINA-B, SMU, CONCHATORO | 4 |
| Industrials | VAPORES, LTM, QUINENCO, SALFACORP | 4 |
| Materials | CAP, CMPC, SQM-B | 3 |
| Consumer discretionary | CENCOSUD, FALABELLA, RIPLEY | 3 |
| Real estate | CENCOMALLS, PARAUCO, MALLPLAZA | 3 |
| Communications | ENTEL | 1 |
| Energy | COPEC | 1 |
Source: composition published by the Santiago Stock Exchange, via Chócale; sectors according to Rankia.
Does your brand speak to investors and executives who follow the IPSA? Advertise in Pauta Financiera.
Advertise with usHow the IPSA has done in 2026
The IPSA started 2026 strongly: in January it rose 8.96% to 11,420.07 points and set a record close of 11,627.58 points, according to the Santiago Stock Exchange. From there it lost steam: it fell in February (-4.75%) and March (-2.18%), recovered between April and August, when it returned to 11,315.26 points, and then fell back in September (-3.06%) and, above all, in October (-6.52%).
View the data as a table
| IPSA | |
|---|---|
| Oct-25 | 9,428.89 |
| Nov-25 | 10,128.58 |
| Dec-25 | 10,481.40 |
| Jan-26 | 11,420.07 |
| Feb-26 | 10,877.74 |
| Mar-26 | 10,640.08 |
| Apr-26 | 10,908.30 |
| May-26 | 10,788.19 |
| Jun-26 | 10,839.80 |
| Jul-26 | 11,016.85 |
| Aug-26 | 11,315.26 |
| Sep-26 | 10,969.49 |
| Oct-26 | 10,254.15 |
| Month | Close (points) | Monthly change |
|---|---|---|
| November 2025 | 10,128.58 | +7.42% |
| December 2025 | 10,481.40 | +3.48% |
| January 2026 | 11,420.07 | +8.96% |
| February 2026 | 10,877.74 | -4.75% |
| March 2026 | 10,640.08 | -2.18% |
| April 2026 | 10,908.30 | +2.52% |
| May 2026 | 10,788.19 | -1.10% |
| June 2026 | 10,839.80 | +0.48% |
| July 2026 | 11,016.85 | +1.63% |
| August 2026 | 11,315.26 | +2.71% |
| September 2026 | 10,969.49 | -3.06% |
| October 2026 | 10,254.15 | -6.52% |
Source: Santiago Stock Exchange, Monthly Statistical Summary for October 2026. Changes calculated by Pauta Financiera from month-end closes.
October's drop took the index to its lowest level since June 8. The exchange described it as a widespread rotation toward lower-risk assets, with an especially negative final week (-4.6%) and a 2.8% fall on the last day of the month. Over the same period the dollar climbed toward CLP 1,000, so measured in dollars the monthly loss was 8.2%.

The most traded IPSA stocks
In October 2026, CLP 3.24 trillion in stocks changed hands on the Santiago Stock Exchange, 7% less than in September. The ten most traded stocks added up to CLP 2.17 trillion, led by LATAM Airlines, with more than CLP 563 billion, followed by SQM-B and Banco de Chile.
The IPSA in 2025: the best year in three decades
To understand 2026 you have to look at the year before. In 2025 the IPSA closed at 10,481 points, up 56.21% in pesos and 72.16% in dollars, according to Ex-Ante. It was its best year since 1993 and ended with 72 record highs, a feat only seen before in 1991, according to Diario Financiero.
| Indicator | Figure | Source |
|---|---|---|
| 2025 close | 10,481.40 points | Santiago Stock Exchange |
| 2025 return in pesos | +56.21% | Ex-Ante |
| 2025 return in dollars | +72.16% | Ex-Ante |
| Record highs in 2025 | 72 | DF |
| 2026 change (through October 30) | -2.17% | Santiago Stock Exchange |
| 12-month change (Oct 25 to Oct 26) | +8.75% | Calculated from exchange data |
- 1977The IPSA is bornThe Santiago Stock Exchange creates its index of the most traded stocks.
- Aug 6, 2018S&P Dow Jones Indices takes overRenamed S&P CLX IPSA, it goes from a maximum of 40 stocks to 30.
- 2025Best year since 1993Up 56.2% in pesos with 72 record highs.
- Jan 2026Record of 11,627.58 pointsNew all-time closing high, according to the Santiago Stock Exchange.
- Aug 20, 2026The MSCI IPSA is unveiledThe Santiago Stock Exchange publishes the 31 companies of the new index.
- Sep 1, 2026MSCI takes chargeFirst day of the MSCI IPSA: it closes at 11,386 points (+0.63%).
- Oct 2026Worst month since 2023Falls 6.52% to close at 10,254.15 points.
How to invest in the IPSA
You cannot buy the IPSA directly, but some instruments track it: index mutual funds and investment funds, and ETFs that trade on the Santiago Stock Exchange, as well as buying the underlying stocks through a broker. Before investing, check the management fee, the instrument's liquidity and the risk: as 2026 shows, the index can go from a record to a 10% drop in a few months.
For savers in Chile, the IPSA sits alongside other benchmarks: the UF measures the daily inflation used to adjust deposits, and the UTM sets the brackets of the tax paid on wages.
Frequently asked questions about the IPSA
What is the IPSA?
The Índice de Precios Selectivo de Acciones, the main index of the Santiago Stock Exchange. It groups Chile's largest and most traded stocks.
How many companies are in the IPSA?
31 since September 1, 2026, when MSCI took over its administration. Between 2018 and August 2026 it had 30.
How has the IPSA done in 2026?
Through October 30 it is down 2.17%: it closed at 10,254.15 points, versus 10,481.40 at the end of 2025.
What is the IPSA's record?
The all-time closing high of 11,627.58 points, set in January 2026 according to the Santiago Stock Exchange.
Who calculates the IPSA?
MSCI, since September 1, 2026. Before that, S&P Dow Jones Indices did, from August 2018.
This information is journalistic and educational, not investment advice. Past returns do not guarantee future results.