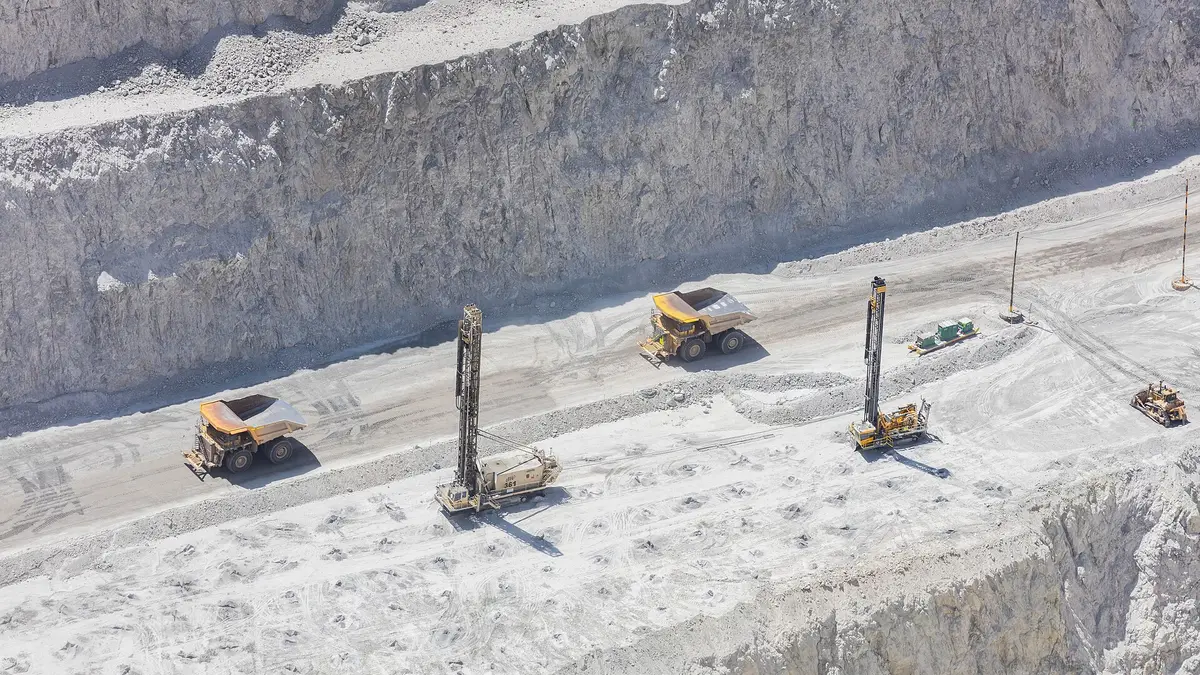
The Imacec, the monthly economic activity indicator calculated by the Central Bank, grew 0.2% in September 2026 compared with the same month of 2025. The result, published on Monday, November 2 (Central Bank), broke two straight months of declines, but hides an economy split in two: mining contracted 12.1% due to lower ore grades and a temporary suspension of operations, while non-mining activities grew 2%. September also had one more business day than a year earlier. In the seasonally adjusted series, activity rose 1.9% from August, although it is still 0.9% below twelve months earlier, according to the breakdown published by Emol.
View the data as a table
| Imacec | +0.2% |
| Mining | -12.1% |
| Non-mining Imacec | +2.0% |
| Seasonally adjusted | +1.9% |
What September's Imacec showed by sector
Outside mining, almost everything pushed upward. Manufacturing grew 4.5%, other goods 4% (agriculture, construction, electricity and fishing, among others) and retail and wholesale trade 4.5%. Services, the largest sector of the economy, advanced only 0.9%, supported by personal services, particularly health. Trade reflects household consumption, which the Central Bank projects at 1.7% for 2026 in its latest Monetary Policy Report (Emol).
| Component | August 2026 | September 2026 |
|---|---|---|
| Total Imacec | -1.0% | +0.2% |
| Mining | -17.4% | -12.1% |
| Non-mining Imacec | +1.4% | +2.0% |
| Manufacturing | — | +4.5% |
| Other goods | — | +4.0% |
| Trade | +2.2% | +4.5% |
| Services | +0.8% | +0.9% |
Source: Central Bank, press releases for the August Imacec and September Imacec, with the breakdown published by Emol. Year-on-year change in the original series; preliminary figures that the Central Bank revises with each release. A dash means the August figure for that component was not in the sources consulted.
Activity in 2026: nine months of drops and rebounds
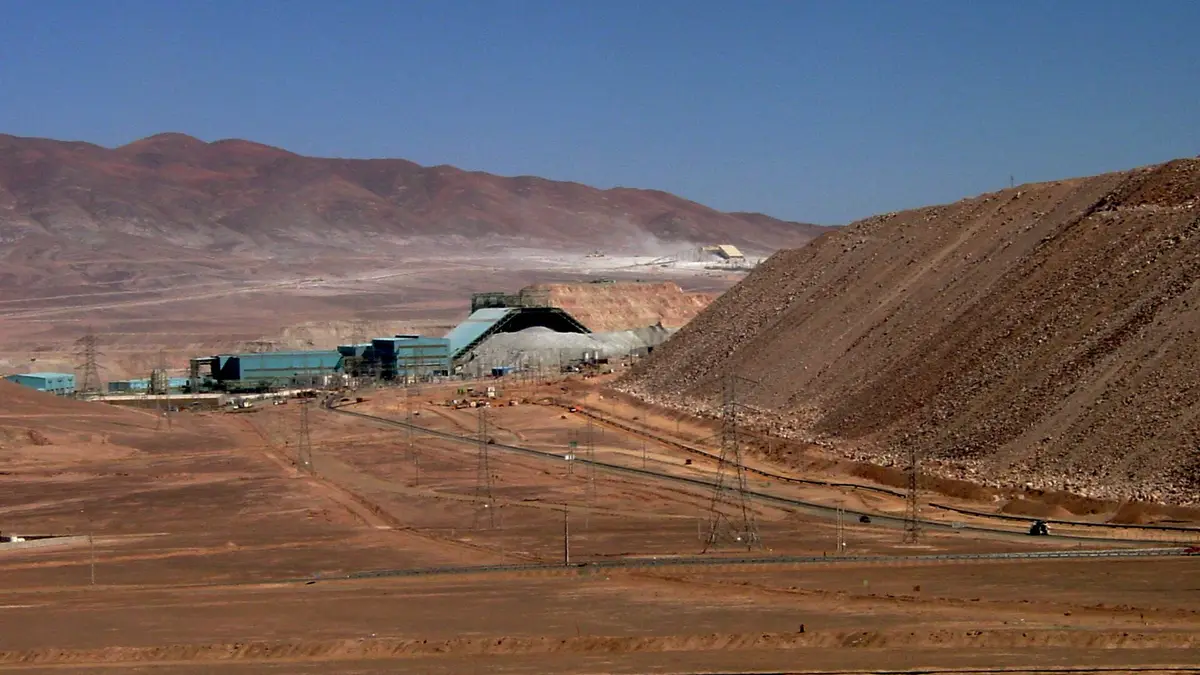
September is only the second month of the year with clear growth. According to the preliminary figures reported in each release, the Imacec fell 0.1% in January, 0.3% in February, 0.1% in March, 1.2% in April and 0.9% in May; it rebounded 2.4% in June on mining, and fell again by 1.5% in July and 1.0% in August. The common thread is copper: mining rose 9.8% in June and then fell 9.3% in July, 17.4% in August and 12.1% in September. The metal's price and its effect on the peso are in our guide to the copper price today.
View the data as a table
| Imacec | |
|---|---|
| Jan | -0.1% |
| Feb | -0.3% |
| Mar | -0.1% |
| Apr | -1.2% |
| May | -0.9% |
| Jun | 2.4% |
| Jul | -1.5% |
| Aug | -1.0% |
| Sep | 0.2% |
The national accounts series confirms the weakness: GDP fell 0.2% in the second quarter and the revised first quarter came in at -0.3% (Central Bank). With those figures, the Central Bank cut its 2026 growth forecast in September to a range of 0.25% to 0.75%, from the 1% to 1.75% it estimated in June (Emol).
| Indicator | Figure | Source |
|---|---|---|
| GDP first quarter 2026 (revised) | -0.3% | Central Bank |
| GDP second quarter 2026 | -0.2% | Central Bank |
| 2026 GDP forecast (June report) | 1% to 1.75% | IPoM |
| 2026 GDP forecast (September report) | 0.25% to 0.75% | IPoM |
| Unemployment July-September 2026 | 9.8% | INE |
Sources: Central Bank, second-quarter national accounts; September Monetary Policy Report via Emol; INE, national unemployment rate for July-September, published on October 29, 2026.

What the Imacec signals for third-quarter GDP
The Central Bank will publish third-quarter GDP on Wednesday, November 18, together with revisions to the first and second quarters. The period's three preliminary Imacec readings (-1.5% in July, -1.0% in August and +0.2% in September) average -0.8%. That simple average is not an official estimate and revisions may move it, but it suggests that quarterly GDP would again show a negative year-on-year change: it would be the third consecutive quarter in the red. If confirmed, the figure will arrive one day after the Financial Stability Report, which we review in the article on the Financial Policy Meeting.
Does your brand want to reach readers who follow every Central Bank release? Advertise on Pauta Financiera.
See advertising optionsHow the indicator is calculated and why its figures change
The Imacec is built from output data for each sector (mining, manufacturing, trade, services, construction and others) and is published around the first business day of the second following month: September's came out on November 2. Because many sources arrive later, the Central Bank revises the figures in subsequent releases and, above all, when it delivers quarterly GDP. June is an example: it was first reported at 2.4% growth and later came in at 2%. That is why each Imacec is best read as an early estimate rather than a final figure.
Mining's weight explains much of the volatility. In July, besides the 9.3% drop in mining, manufacturing fell 3.1% and the non-mining Imacec slipped 0.3%, making it the worst month of the year (Central Bank). In September, by contrast, the rest of the economy grew 2%. If that pace holds in the fourth quarter and mining leaves the suspensions behind, the year could close within the Central Bank's projected range.
What a weak economy means for rates, jobs and wallets
An economy that barely grows usually means less hiring: the unemployment rate was 9.8% in July-September, according to INE. For the Central Bank, weak activity weighs on its rate decisions together with inflation, which reached 4.5% year on year in October, as we reported in the October CPI article. With the monetary policy rate at 4.5% since the October 27 meeting, consumer and mortgage loan rates still have no clear reason to fall.
The next Imacec, for October, will be published in early December according to the Central Bank's usual calendar. Meanwhile, the November 18 figure will show whether September's rebound is enough to change the reading of the quarter.
Frequently asked questions about the Imacec
What is the Imacec?
It is the Monthly Economic Activity Indicator calculated by the Central Bank of Chile. It summarizes each month's output of goods and services and works as an early read of GDP, which is published quarterly.
How much did the September 2026 Imacec grow?
0.2% year on year, with mining at -12.1% and the non-mining Imacec at +2%. Seasonally adjusted, it rose 1.9% from August.
When is third-quarter 2026 GDP published?
On Wednesday, November 18, 2026, according to the Central Bank.
Why did mining fall?
According to the Central Bank, because of lower ore grades and a temporary suspension of operations, which reduced copper extraction.